
A Google Analytics dashboard is a customizable report that displays key website performance metrics and user behavior data in one place using data visualizations like charts and graphs. Instead of navigating multiple reports, you can use a dashboard to quickly monitor key performance indicators (KPIs) such as traffic sources, conversions, and bounce rates to understand and analyze your website's health. We provide every website client with a basic Google Analytics dashboard. All dashboards can be customized to fit your company's needs. We can also provide you with custom URLs or scalable QR codes to track your online web advertising.
Key features and benefits
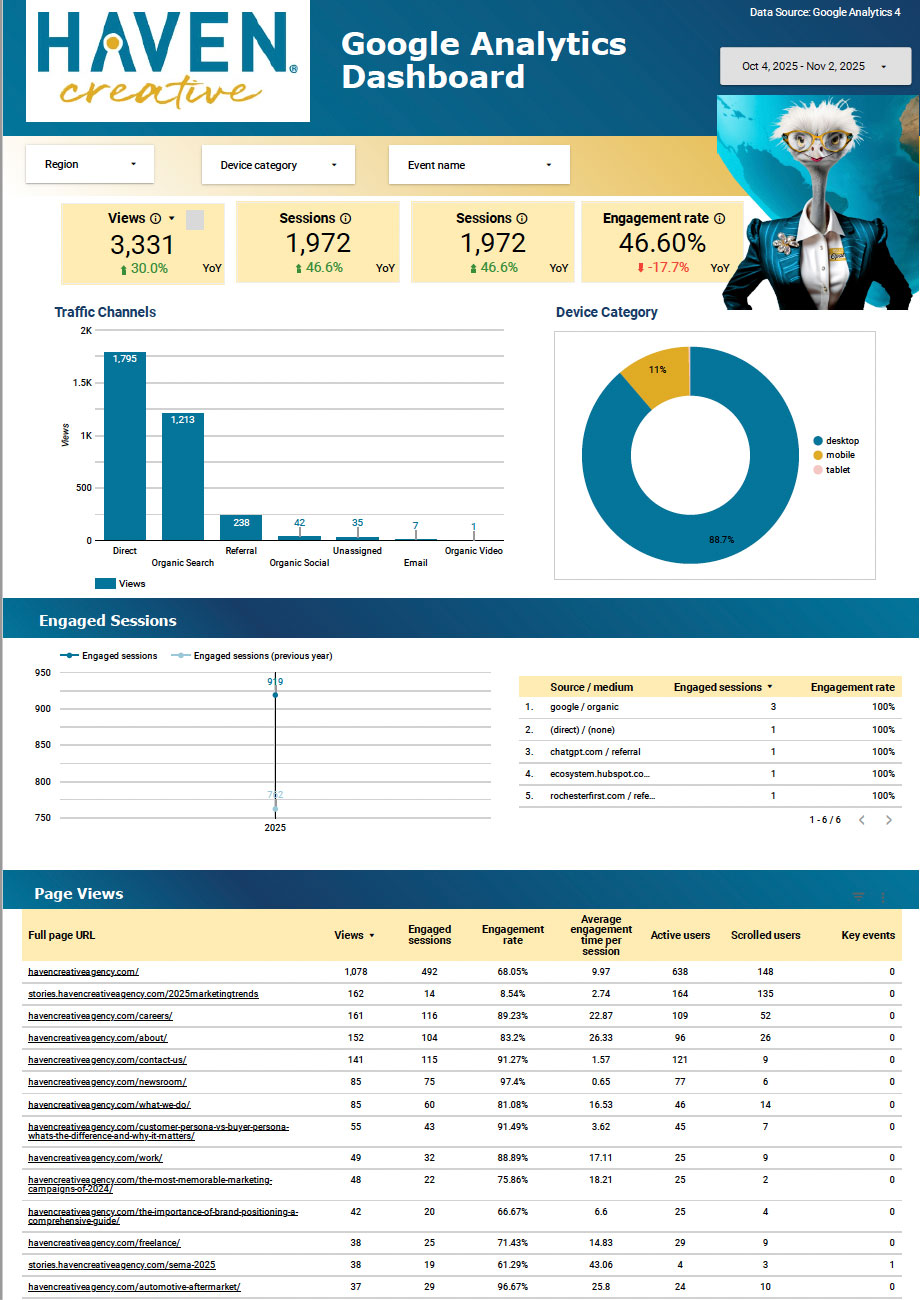
- Centralized view: Consolidates data from different reports, such as traffic sources, user demographics, and conversion rates, into a single, easy-to-understand view.
Customizable: You can tailor dashboards to your specific needs by selecting and arranging widgets that display the most relevant data for you. - Visual data: Uses various visual aids like charts, tables, and maps to make complex data easier to interpret and analyze.
- Trend analysis: Allows you to track metrics over different time periods to identify trends and see how your website is performing over time.
- Improved efficiency: Saves time by letting you quickly check your website's performance without having to click through multiple reports.
What we can monitor
- Traffic sources: Where visitors are coming from (e.g., organic search, social media, direct).
- User behavior: How users interact with your site, including metrics like bounce rate, time on site, and page views.
- Conversions: Tracking goals, such as purchases or sign-ups.
- Audience demographics: Characteristics of your users, such as location, age, and gender.


